
Originally Published by PV Tech Power
By Hannah Rasmussen, kWh Analytics, and Ben Browne
The growth of the solar industry in the United States has been staggering, with no signs of slowing down [1]. As the PV industry matures, there is a renewed focus on accuracy and financial stability as the solar industry reaches its adolescence. Financing of a given project is closely tied to its expected energy production, so more accurate energy projections will improve accuracy in financial modeling. The kWh Analytics 2022 Solar Generation Index [2] found that PV systems across the US are underperforming by 7-13% compared to their projected energy generation. There is a clear discrepancy between modeled forecasts and reality, and overly optimistic availability assumptions used in PV system modeling can contribute to this discrepancy. At a high level, availability is a metric that describes the degree to which an energy plant (in this case, a solar energy plant) is online and producing electricity, and has historically been assumed to be 99% for PV systems. Recent studies from kWh Analytics reveal that 99% availability is an overly optimistic value and that 97% is a more realistic metric to use when modeling photovoltaic systems. Using this more realistic availability assumption will lead to improved accuracy in financing and a more economically resilient solar asset class.
Faulty Forecasts can Threaten Solar Investments
Many external factors and internal components affect a PV system’s production, and all these are taken into account in projected energy modeling. Projected energy is affected by historical irradiance, system design, expected availability, and many more site characteristics. Developers use probabilistic forecasting to estimate a PV site’s energy production and inform financing. Variability in yearly irradiance and uncertainty in modeling assumptions creates a probability distribution (Figure 1) of the energy that a given PV system could produce in a single year. The metric used to describe the annual energy production that a PV system is expected to exceed 50% of the time is called a P50. For example, if a PV system has a P50 of 100 MWh, it is expected to produce more than 100 MWh for half of its operational years and less than 100 MWh for the other half of its operational years (ignoring the effects of degradation). If the P50s are overestimated due to overly optimistic availability assumptions, a system will achieve its P50 target less than 50% of the time over its lifespan. As a result, investors won’t receive their expected return on investment. If this happens widely across the industry, faith in photovoltaics among the public will be shaken, and investor willingness to finance PV will decrease. For these reasons, it is imperative to be as accurate as possible when developing models for this asset class.
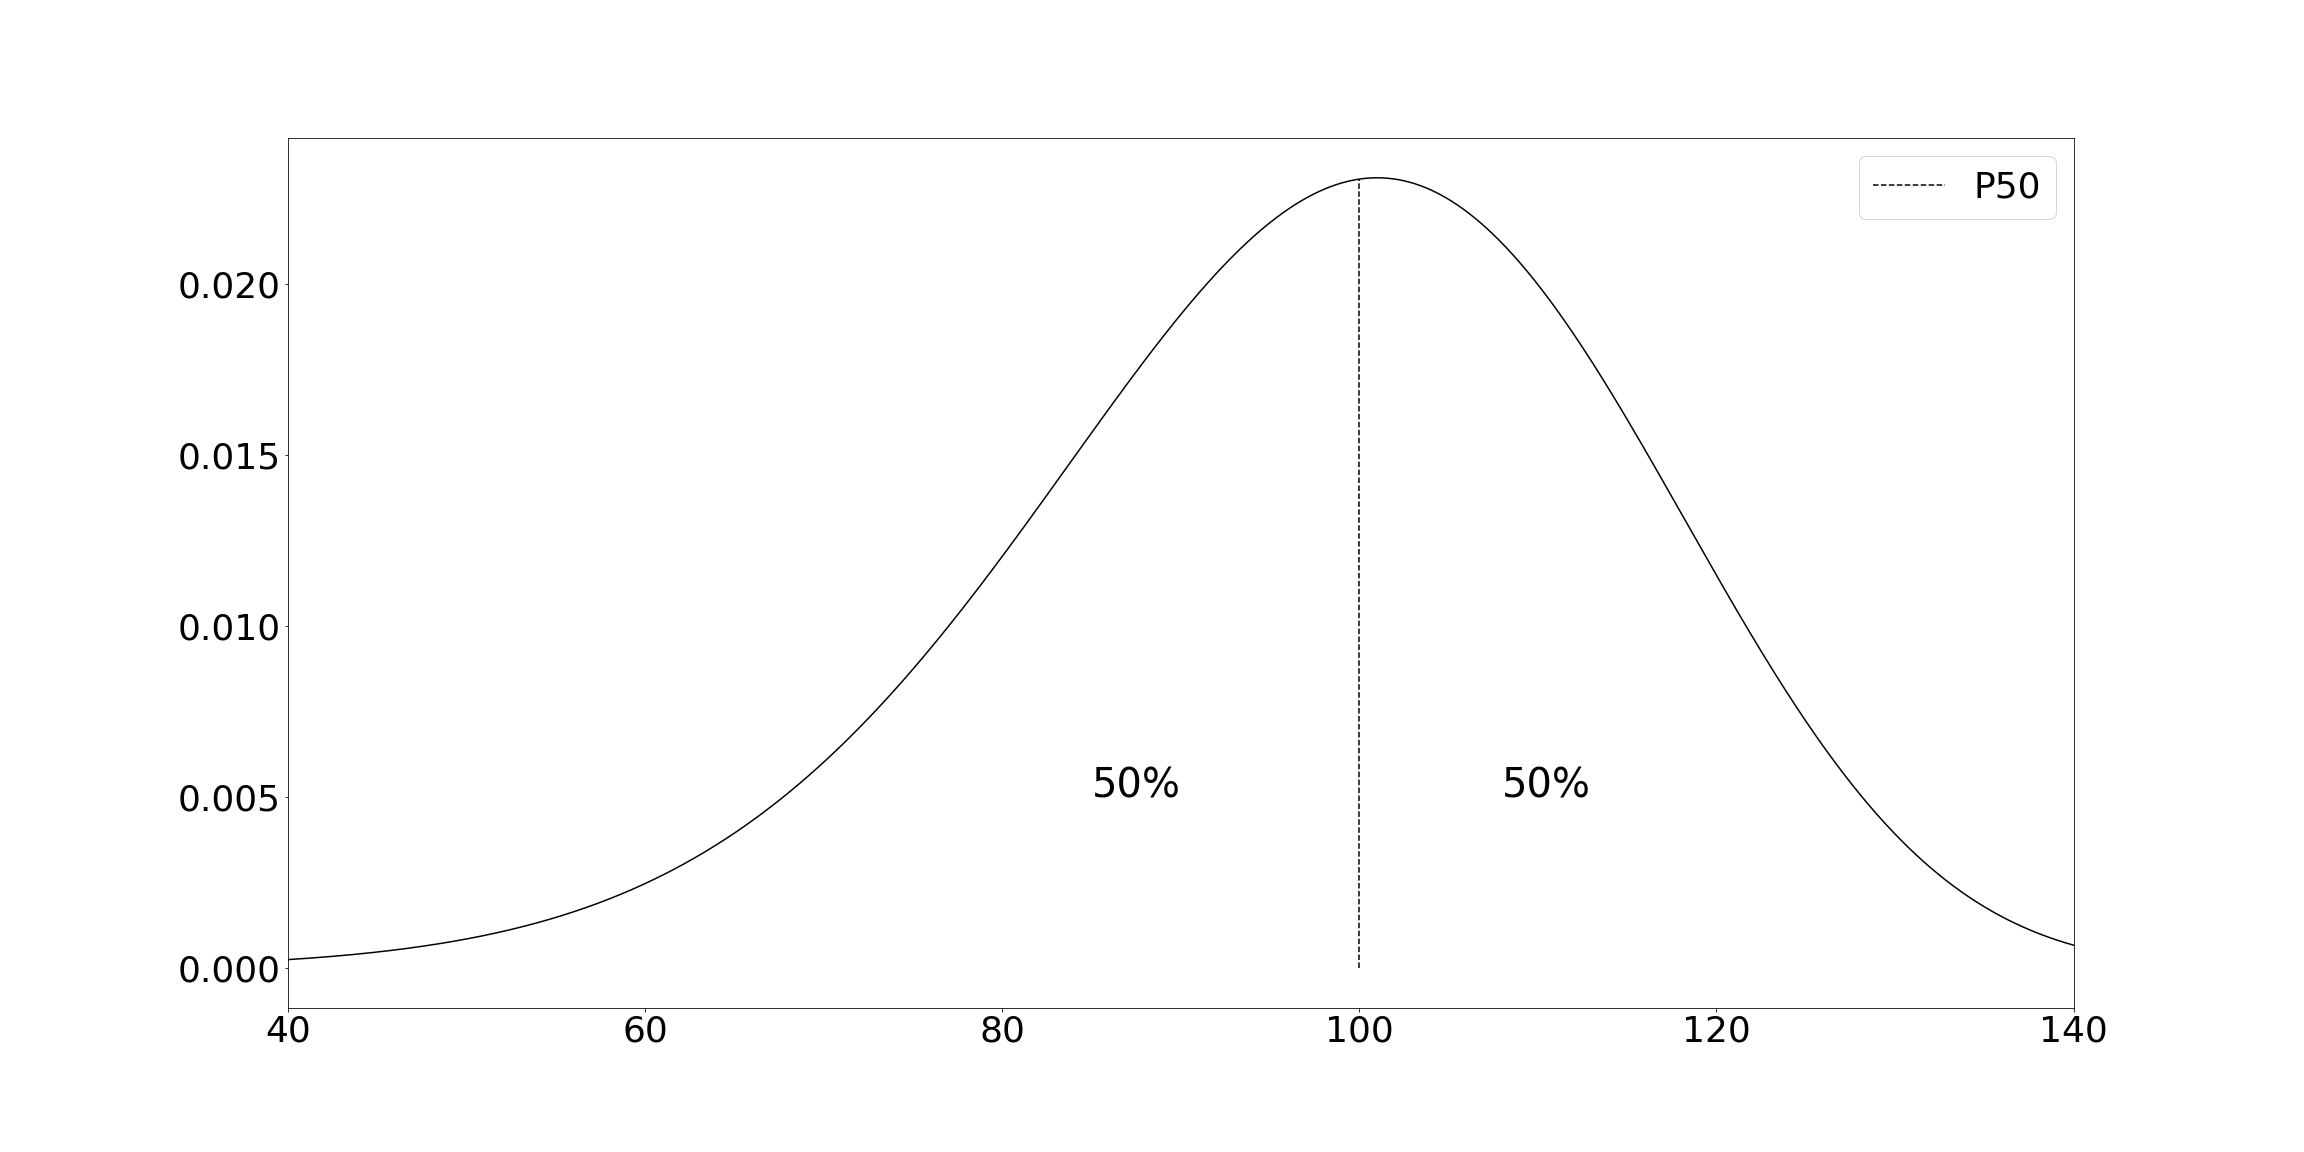
Figure 1: Probability distributions are used to model PV systems’ projected energy generation. The P50 describes the projected energy value that a PV system is expected to exceed 50% of the time.
Finding Clarity Despite the DIY (Define-it-yourself) Nature of Availability
Availability is intended to describe the degree to which a PV system is fully operational. Availability calculations can include downtime due to equipment failures, equipment repairs, and preventative maintenance for a partial or entire system. This metric does not typically include grid-related outages or curtailment. However, there is a financial argument to include all kinds of downtime in availability measurements, as any time a system is partially or completely offline, revenue is not being generated. The more precise definition of availability remains debated in the solar industry. Most PV system and operations and maintenance (O&M) contracts have their own definitions of availability, centered around events for which the O&M provider assumes responsibility. It follows that availability definitions can vary greatly depending on what kinds of energy losses are excluded from the contract. The reported metrics can even go as far as to vary in units of measurement, as some definitions of availability are based on length of downtime and some are based on the amount of energy that could have been produced during downtime. It is worth noting that the definition of availability most useful to an O&M provider is likely quite different from that most useful to an asset manager. The O&M provider is incentivized to exclude energy losses that they do not feel are within their scope of work, while the asset manager would be most interested in any time the project is not producing revenue when it is expected to be. This disparity in perspective between the boots on the ground and the suits financing projects results in lack of clarity about the definition of availability throughout the industry.
While the need for O&M providers to define availability on a per-contract basis is unavoidable, this variety in definition creates challenges to analyzing availability data reported from the field. kWh Analytics suggests that in conjunction with O&M-defined availability, a standardized availability be reported in each MOR. The IEC standard 63019:2019 [3] provides a framework for standardizing the definition of energy-based availability for PV systems, while the Best Practice for Developing Availability Guarantee Language in PV O&M Agreements [4] from Sandia National Labs provides standardization for calculating downtime-based availability. Adoption of one or both standards like these would help clarify availability data for everyone. Both energy-based and downtime-base availability calculations have unique use cases, but an advantage of reporting availability that was calculated using downtime rather than estimated energy lost is that these metrics would foster ease of comparison of availability between all PV systems, as the use of estimated energy lost in availability calculations introduces variance due to differences in probabilistic modeling methods across PV systems.
On a monthly or quarterly basis, O&M providers report metrics for a site in monthly operating reports (MORs) or quarterly operating reports (QORs). These MORs can contain availability data as reported by the O&M provider. Through our insurance products and through our data analytics product, HelioStats, kWh Analytics has collected data-driven insights from varied perspectives on PV site performance via these MOR reports. With this arsenal of data, we are able to analyze availability as reported by O&M providers themselves, from PV sites across varied regions, capacities, O&M providers, and site designs. Despite the most useful definition of availability differing for O&M providers and asset owners, the O&M-reported metrics still provide valuable insight regarding PV availability. Since O&M contracts can define availability as excluding some downtime events, the “true” availability of the PV systems in this analysis may be even lower than the figures reported below. kWh Analytics has examined the common (but recently increasingly-challenged [5]) industry assumption that PV systems can be expected to achieve 99% availability for their lifetime and should be modeled as such. We ultimately find that this is an unreasonable expectation for any PV site, regardless of season, size, or region, and suggest a new industry availability standard of 97%.
Deciphering the Data
The kWh Analytics database has hundreds of Commercial & Industrial (C&I) and Utility-scale systems and hundreds of thousands of months of operating data. However, only 485 of the C&I and Utility-scale systems in our database have reported availability data in their MORs, with about 26,000 availability data points in total. This reflects the lack of frequency with which availability data is reported in MORs. We acknowledge these caveats in the analysis that follows:
Availability is sometimes reported at the quarterly level as opposed to the monthly level. Quarterly availability data is excluded from any monthly analyses.
All the data in this analysis is defined by the O&M provider. MORs typically do not provide explicit definitions of how the availability values are calculated, so we are limited in our ability to conduct any adjustments on values reported in the MORs.
Both downtime-based and energy-based availability is included in these analyses. It is often not reported how a given report’s availability values are calculated and thus is not feasible to distinguish downtime-based and energy-based calculations from each other.
Below, we analyze reported grid, inverter, and system-level availability. It is rare for all three to be reported in a given MOR – in fact, it is often the case that only one of the three is reported. Therefore, the set of system-years in each data set is different.
Systems used in this analysis are limited to the contiguous 48 states.
Starting with 485 C&I and Utility-scale systems in the kWh Analytics database with availability data, we took the following data-cleaning steps to include only the highest quality data in our analysis:
Only include points that comprise a full system-year.
Assume vaguely defined availability reflects system-level availability.
Drop systems that ever report greater than 100% availability.
Drop points that report 0% availability in case they are falsely reported null values.
After performing these data-cleaning steps, 165 systems with high quality availability data remained to be included in this analysis. Many systems were dropped in the step to include only full system-years of data, such that this drop in systems reflects the lack of consistency with which availability data is reported across MORs. For example, if a system changes hands between O&M providers, and each O&M provider reported different kinds of availability (or one reported availability and the other did not), the full year of availability data is jeopardized. Asset owners have the power to ask for improved reporting of availability to allow for increased transparency of frequency of system downtime. The industry should move towards required and standardized availability reporting to improve understanding of this important metric.
A Left-Skewed Reality

Figure 2: The distributions of grid, inverter, and system availability values from the kWh Analytics database aggregated to the system-year level. All three kinds of availability exhibit a long-left tail distribution with mean values between 96.4% and 97.2%.
From the cleaned data, kWh Analytics averaged availability across the three kinds of metrics most often reported in the MORs that we see: grid, inverter, and system availability. The energy loss events included in each availability value is defined by the O&M provider, but in general, the following definitions provide an overview of these three kinds of availability:
Grid availability: availability including lost energy only due to grid outages or curtailment
Inverter availability: availability including lost energy only due to inverter outages
System availability: availability including lost energy due to any unforeseen energy loss event
All three types of availability have P50s close to 99%, as shown in Figure 2. However, a long-left-tail distribution can be seen for all three metrics, with some system-year availability values falling below 80%. The low values can be driven by equipment failures, equipment repairs, preventative maintenance, and are not a result of weather-related energy loss. The long left tails pull the average (“mean” or “”) availability down significantly, giving an average availability between 96.4% and 97.2% depending on the kind of availability. Others have published similar findings that availability realized in the field is significantly below the purported 99% [6].
P50s are useful to convey the center of a dataset when the distribution the data follows is known to closely resemble a normal (bell-shaped) curve. This is especially true if there are outliers in the dataset that are orders of magnitude off from the rest of the data. The histograms shown in Figure 2 do not resemble a normal distribution at all and instead are heavily skewed left, so the usefulness of P50s to convey the expected availability of a PV site is immediately called into question.
At present, financial models of PV sites only include one availability number - usually 99% - in the model. Ideally, availability would be modeled using a distribution, like those shown in Figure 2. Instead, most current PV models use a single, constant availability value, and it would be a heavy lift to rebuild these models to include this kind of best-practice availability modeling. In the interim, we suggest using mean availability instead of P50s for a system’s single modeled availability value, as mean availability takes the long left tail of the distribution of values into account while P50s do not. Specifically, our analysis suggests that a mean availability of 97% would be far more reflective of PV site lifetime availability than a P50 of 99%.
The Effects of Season, Size, and Location on availability
A clear next step in our analysis was to investigate the effects of seasonality, DC capacity, and region on availability. It must be noted that each of these omits some data from the larger dataset. The monthly dataset omits quarterly data used in the larger analysis. The DC capacity dataset and location dataset omits systems for which the kWh Analytics database does not have DC capacity and location data, respectively, as many MORs do not provide these metrics.
As shown in Figure 3, grid, inverter, and system availability may have slightly different seasonality trends, but in sum, it seems that availability trends lower from April to September, when losses due to low availability are most costly. Possible causes for this lower availability include increased animal activity during these months (causing shorts in equipment), moisture infiltrating equipment in rainy climates, high temperatures increasing strain on electrical systems, curtailment, and outages due to severe convective storms. Further analysis comparing availability to maintenance logs would need to be conducted to identify which of these causes, and which other causes not listed, are chief drivers of low availability during these months.
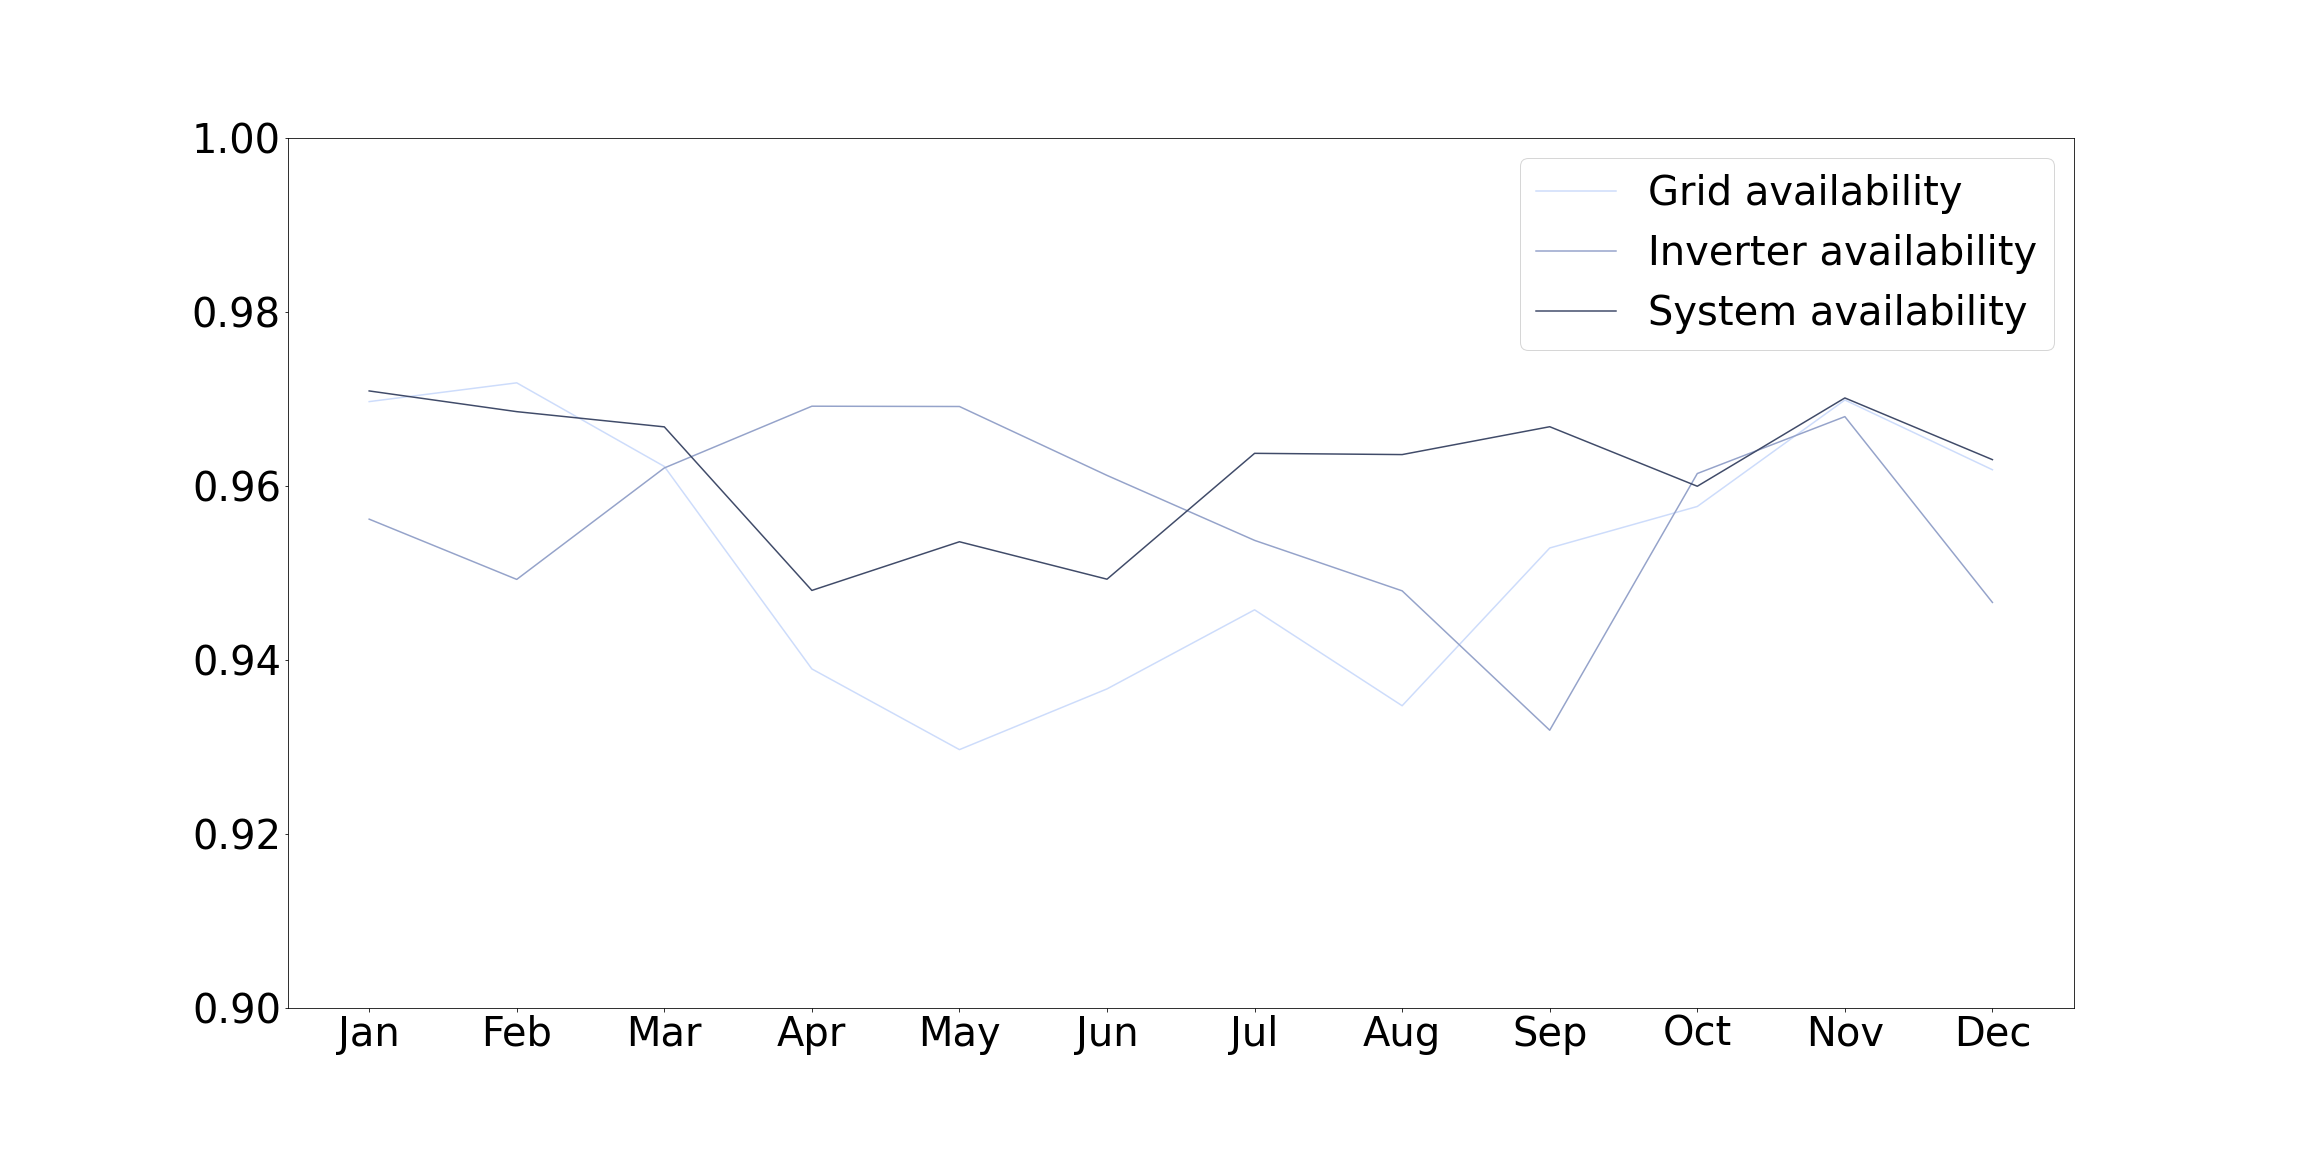
Figure 3: Grid, inverter, and system availability appear to have varying seasonality trends, but all have a dip in availability of some kind between April and September when losses due to low availability are most costly.
In Figure 4, the main bars represent system availability P50s by DC capacity, and the black lines represent the range from P90 to P10 for each grouping of DC capacities to convey the shape of the distribution. 90% of values in a distribution fall above the P90, while only 10% of values fall above the P10. Simply put, a system owner would expect their asset to achieve availability over the P90 value 90% of the time. We find that system availability seems to be independent of site size across utility-scale systems, and that the trend of a left-skewed distribution does appear to be present across all ranges of utility-scale systems. This highlights the need for PV systems of all capacities to adjust availability forecasts to match empirical findings.
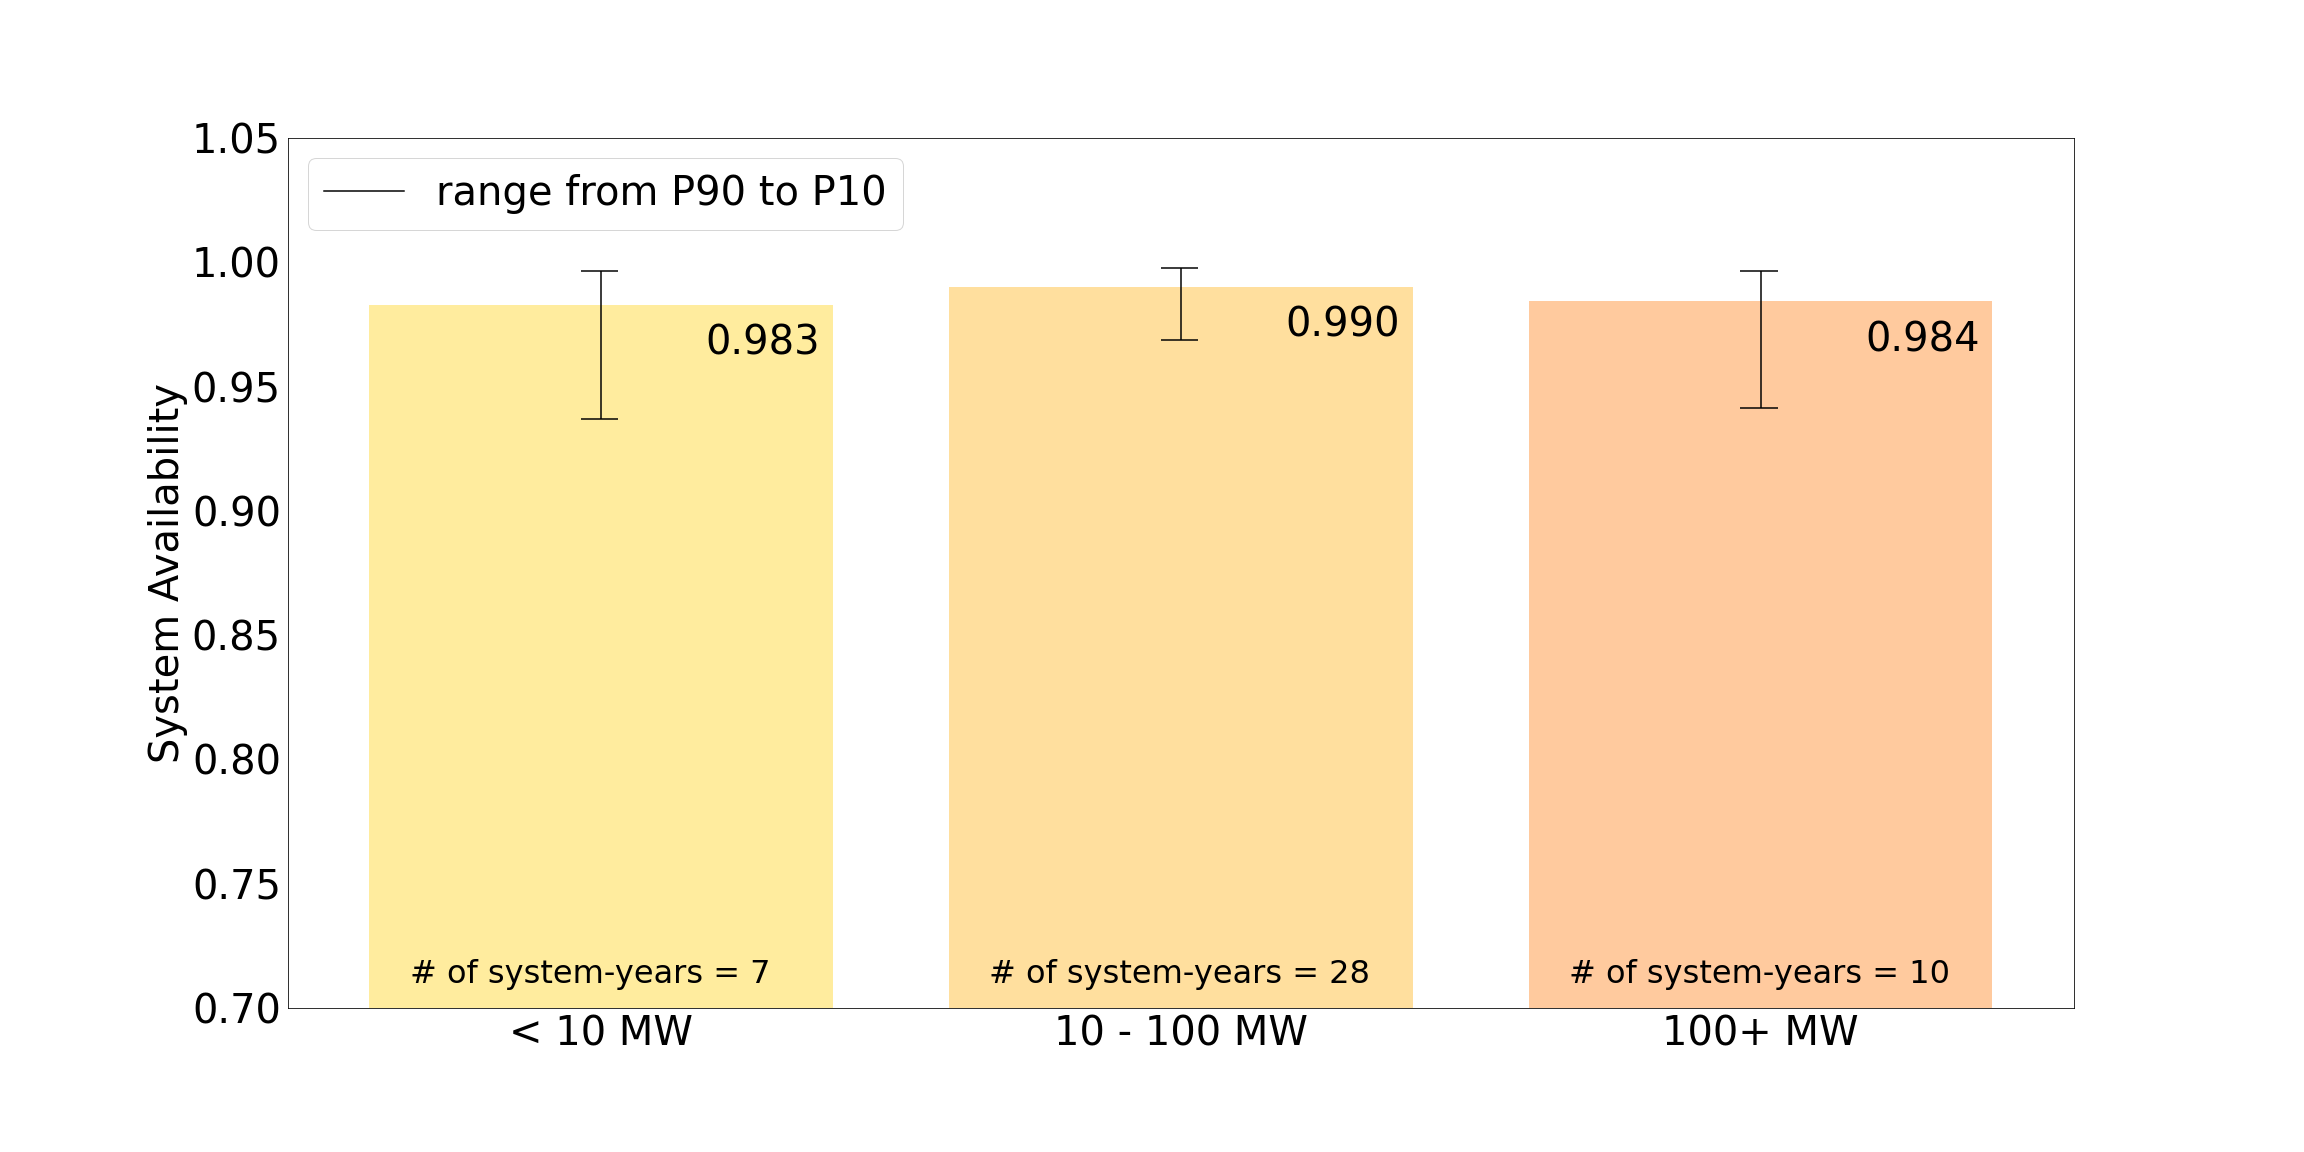
Figure 4: The left skewed availability distribution is present across the range of DC capacities studied, highlighting the need for improvements of availability modeling for PV systems of all sizes.
The results of an analysis of system availability across three regions of the US is shown in Figure 5. The regions are defined according to the legend in Figure 5, and again, the main bars represent the P50s and the black lines represent the range from P90 to P10 for each region. The long left tail trend emerges once more in each region, but appears to be most severe in the Western region of the country. While no one region stands out with lower P50s than the others, the consistent prevalence of a left-skewed distribution highlights the need for more accurate downside modeling in every PV site across the US.
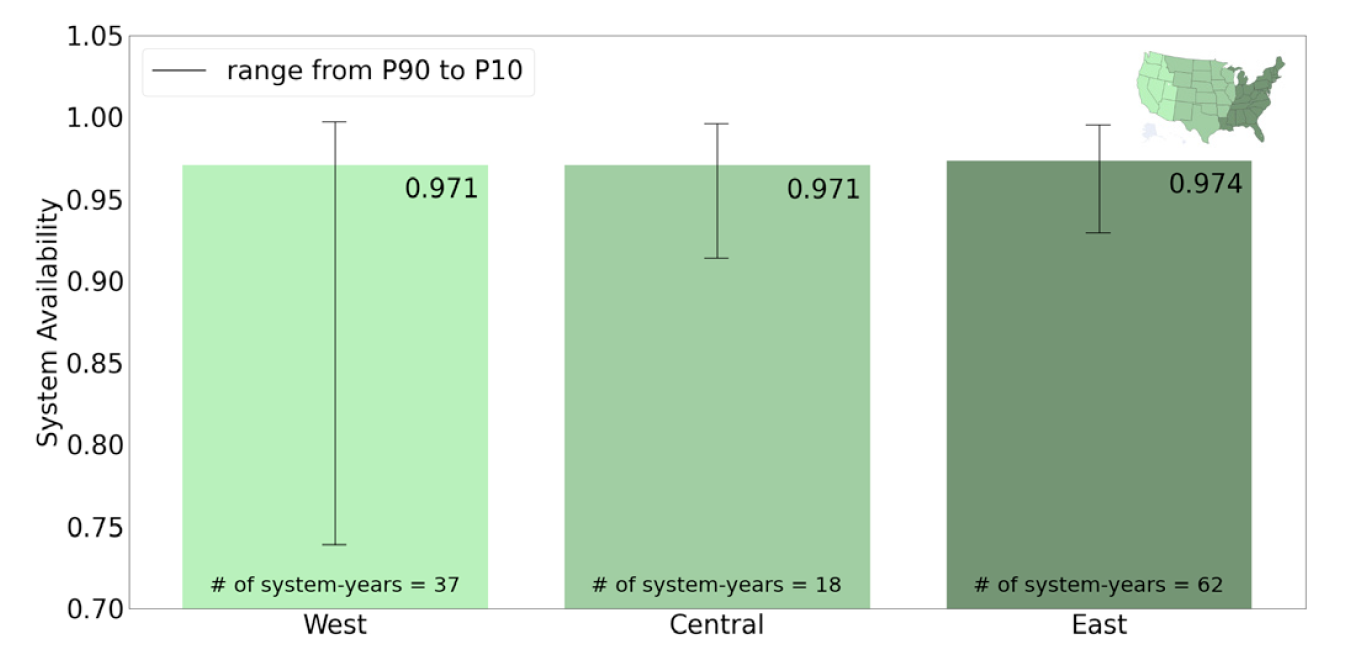
Figure 5: The left-skewed availability distribution is present for all regions, highlighting the need for improvements of availability modeling for PV systems across the US.
Can 99% lifetime availability ever be achieved?
Perhaps you are a responsible asset owner and wish to beat the odds by achieving higher than 97% availability for your site and wish to continue to use 99% in your modeling. Perhaps you are an O&M provider and already have a contract to achieve 99% availability, and want to know how to do so. We maintain that this is an unreasonable expectation, but if a PV site were to achieve it, we expect that it would do so by enacting the following best practices published by leaders in the industry.
The National Renewable Energy Laboratory’s Best Practices for Operations and Maintenance of Photovoltaic and Energy Storage Systems [6] provides an excellent guide for O&M providers that are focused on maintaining high availability. Among many other actionable recommendations, this guide states that “the higher the desired (or contractually required) availability for a plant, the more spare parts will have to be kept in inventory” (p. 52). This handbook provides a comprehensive formula to calculate the number of spare parts to keep on hand for a given equipment piece and describes strategies to maintain a readily accessible stock of spare parts. A strained supply chain, the emergence of new technology, and retired warranties have only made the challenge of finding new parts for sites more difficult since this best practices guide was published over five years ago, making the impact of a spare parts inventory on maintaining high availability even greater.
For an asset owner, the most impactful steps to achieve a high level of availability and ensure longevity of a PV site are taken before the PV system even goes online. Sandia National Laboratory’s A Best Practice for Developing Availability Guarantee Language in PV O&M Agreements [7] highlights the importance of intentionality in an O&M contract, and states that the contract drives the “level and quality of [the] maintenance activities” that are necessary to achieve high availability. The guidelines provided by Budgeting for Solar PV Plant O&M: Practices and Pricing [8] recommend that an asset owner receive third party feedback on a PV system’s O&M strategy from an independent engineer. This work also states that lack of proper allocation of funds for O&M “can ultimately undermine a plant’s lifecycle performance economics” (p. 5). This implies that without appropriate budgeting for O&M, a PV system is at risk of more frequent outages and slower return to 100% availability, leading to a negative feedback loop resulting in lower lifetime availability.
kWh Analytics’ empirical data clearly shows that 99% lifetime availability is not realistic, and incredibly difficult to achieve. Many PV sites continue to be modeled with this high target metric, leading to an avoidable discrepancy between predicted and actual energy generation. Ideally, availability would be modeled as a distribution with a long left tail, shaped by data-driven findings and varied by seasonality, site design, and location. A simple improvement that can be easily implemented with current modeling frameworks is to use a single value that is influenced by the shape of the real-world distribution of availability values. Given that this actual distribution of availability is strongly left-skewed, the mean is more representative of the range of outcomes than the P50, so we recommend using the mean value of 97%.
References
[1] Davis, M., Martinez, S.L., et. al. 2024. US Solar Market Insight Executive Summary 2023 Year in Review. Wood Mackenzie/SEIA US Solar Market Insight®.
[2] 2022. Solar Generation Index. kWh Analytics.
[3] IEC 63019:2019, Information technology — Photovoltaic Power Systems (PVPS) — Information model for availability.
[4] Klise, G.T and Balfour, J.R. 2015. A Best Practice for Developing Availability Guarantee Language in PV O&M Agreements. Sandia National Labs.
[5] Deline, C., Browne, B., Tse, I., Mikofski, M. 2024. Are solar availability assumptions too optimistic? NREL. Webinar.
[6] Deline, C., Anderson, K., et al. 2020. PV Fleet Performance Data Initiative:
Performance Index–Based Analysis. National Renewable Energy
Laboratory. NREL/TP-5K00-78720
[7] Sengupta, Manajit, Aron Habte, Stefan Wilbert, Christian Gueymard, and Jan Remund. 2021. Best Practices Handbook for the Collection and Use of Solar Resource Data for Solar Energy Applications: Third Edition. Golden, CO: National Renewable Energy Laboratory. NREL/TP-5D00-77635. https://www.nrel.gov/docs/fy21osti/77635.pdf.
[8] Enbar, N., Weng, D., and Klise, G. 2015. Budgeting for Solar PV Plant O&M: Practices and Pricing. The Electric Power Research Institute, Inc. and Sandia National Labs.